The headline numbers
Filings by fiscal year, FY 2008 to FY 2026
Annual § 523(a)(8) AP filings nationwide, federal fiscal-year basis (Oct through Sep). The "median days" column is the median time from filing to docket termination for APs filed that fiscal year that have terminated. The DOJ Nov 17, 2022 guidance landed about 6 weeks into FY 2023.
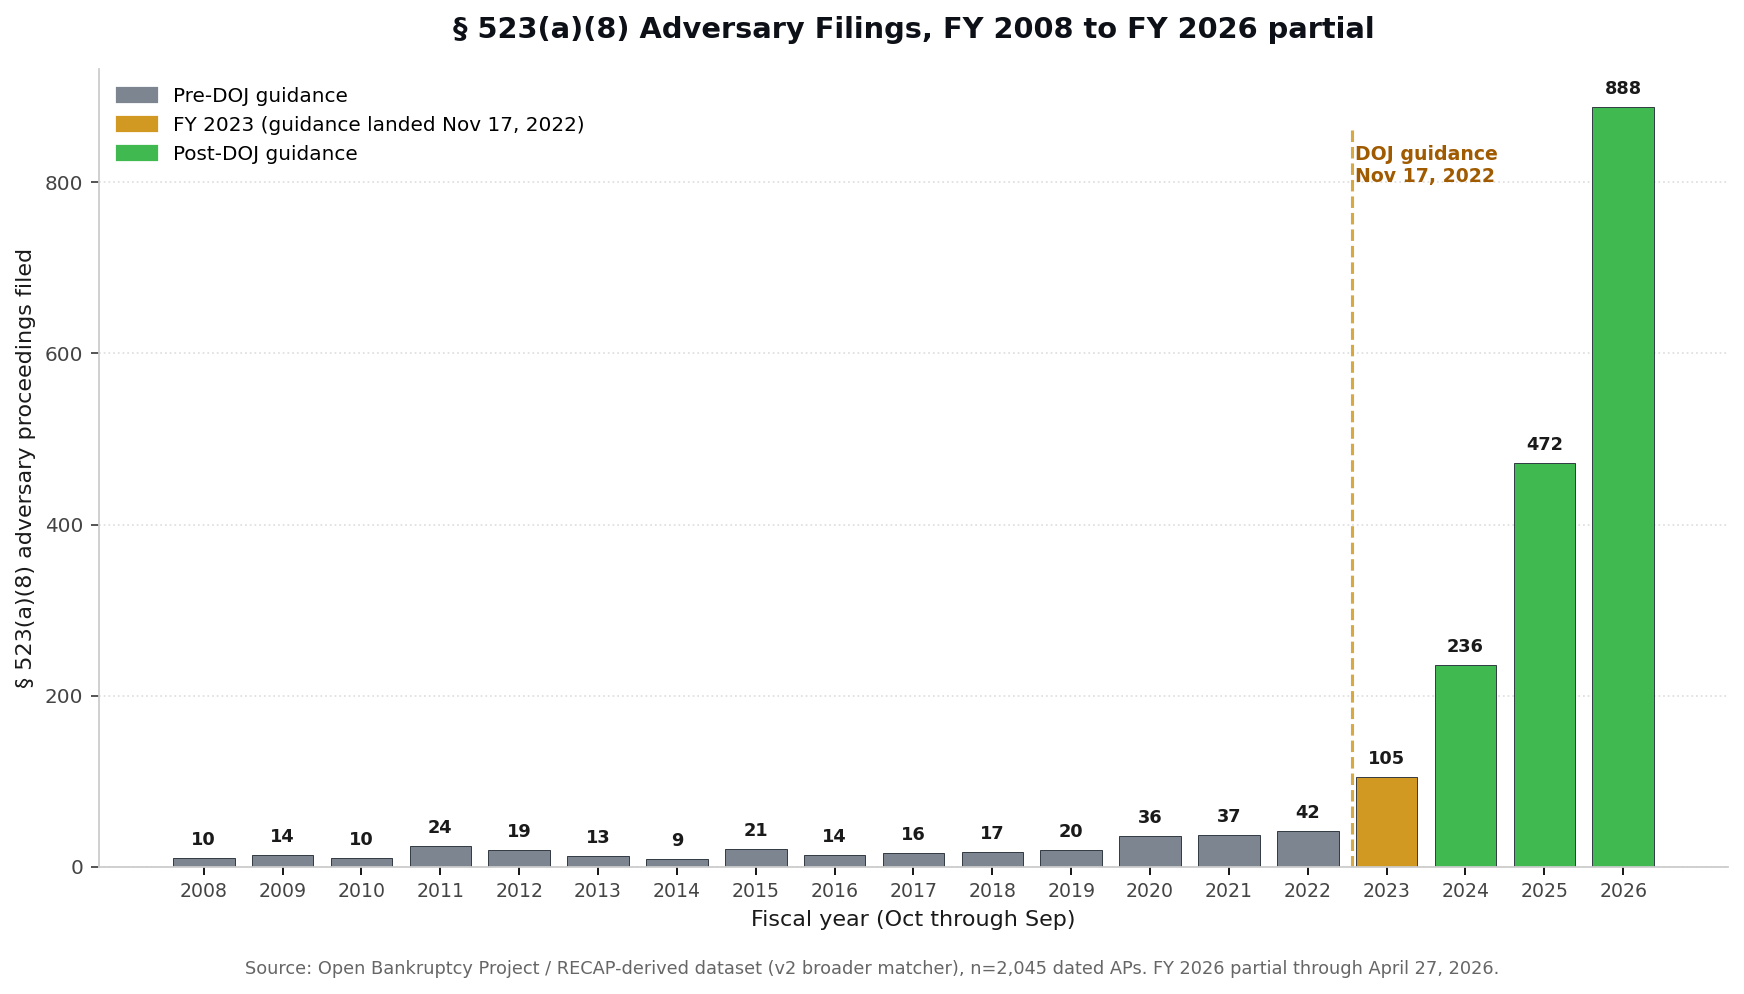
| Fiscal Year | APs filed | Terminated | Median days to dispose | Notes |
|---|---|---|---|---|
| FY 2008 | 10 | 10 | 257 | |
| FY 2009 | 14 | 14 | 274 | |
| FY 2010 | 10 | 10 | 269 | |
| FY 2011 | 24 | 24 | 161 | |
| FY 2012 | 19 | 19 | 285 | |
| FY 2013 | 13 | 13 | 326 | |
| FY 2014 | 9 | 9 | 188 | |
| FY 2015 | 21 | 21 | 369 | |
| FY 2016 | 14 | 14 | 442 | |
| FY 2017 | 16 | 14 | 426 | |
| FY 2018 | 17 | 17 | 475 | |
| FY 2019 | 20 | 19 | 287 | |
| FY 2020 | 36 | 35 | 428 | |
| FY 2021 | 37 | 34 | 251 | |
| FY 2022 | 42 | 41 | 336 | last full FY before the DOJ guidance |
| FY 2023 | 105 | 95 | 280 | Nov 2022 guidance hits about 6 weeks in; +150% over FY 2022 |
| FY 2024 | 236 | 144 | 217 | +125% over FY 2023 |
| FY 2025 | 472 | 21 | 126 | +100% over FY 2024 (most still pending) |
| FY 2026 (partial) | 888 | 1 | 65 | through April 27, 2026; ~7 of 12 months |
Pre-DOJ baseline FY 2008 to FY 2022: n = 302 over 15 years, mean 20.1 per year. The mean was 13.0 per year in v1 of this dataset; v2 broader matcher (Apr 28, 2026) raised the baseline by adding APs styled "Debtor v. United States" plus additional private-servicer captions.
Time to disposition: 27 percent faster post-guidance
For APs that have reached docket termination, the median elapsed time from filing to termination has compressed substantially after the November 2022 DOJ guidance. This is a within-dataset comparison (same matcher, same coverage, before and after).
| Cohort | n terminated | Median days | Mean days | 25th-75th percentile |
|---|---|---|---|---|
| Pre DOJ (filed before 2022-11-17) | 338 of 346 (98%) | 305 | 395 | 142 to 553 |
| Post DOJ (filed on or after 2022-11-17) | 258 of 1,698 (15%) | 223 | 252 | 114 to 367 |
Pre-DOJ APs are nearly all terminated (they are old), while only 15 percent of post-DOJ APs have terminated so far (most are still pending). The 15 percent that have terminated resolve faster than pre-DOJ APs did. This is consistent with the DOJ guidance enabling a streamlined attestation-and-consent process rather than a full Brunner-test trial.
Where else this data lives, and where it doesn't
A reasonable question for any reader: "Isn't this already published somewhere authoritative?" The honest answer is no, not the way it appears here. The pieces exist, but no government agency or commercial publisher runs the synthesis as a public free dataset.
| Source | What it publishes | The gap |
|---|---|---|
| DOJ press releases | August 2023: 632 APs in first 10 months post-guidance. April 2024: 1,220 cumulative through March 2024. | DOJ stopped publishing updates in April 2024. No FY-by-FY breakdown, no district detail, no pre-2022 baseline, no time-to-disposition analysis. |
| Federal Judicial Center IDB | All federal bankruptcy petition filings 2008-present, with chapter, debtor type, debt amounts, pro-se flag, discharge totals. | FJC's bankruptcy IDB is petition-level only. Adversary proceedings are not in the IDB. Verified by query against the FJC dataset (37.9 million petition rows; zero adversary records). |
| U.S. Trustee / EOUST | Internal case-management statistics. | Not public. |
| Department of Education / FSA | Loan portfolio status, default rates, repayment metrics. | Does not publish litigation-side data. |
| AACER / Epiq (commercial) | Comprehensive bankruptcy database including AP filings. | Commercial, paid tiers. They do not publish a free public dashboard or running tracker. |
| NCLC, ABI, academic researchers | Periodic legal-aid analyses and academic studies citing DOJ figures. | They cite DOJ as the authority. They do not run independent counts. Academic studies are slow (multi-year lag) and topic-narrow. |
| CourtListener / RECAP (Free Law Project) | Public mirror of PACER federal court documents and dockets, including bankruptcy adversary proceedings. | The underlying dockets are there, but not labeled by statute (CourtListener's nature-of-suit field is empty for nearly all bankruptcy APs). Counting requires custom queries and methodology. |
This page is OBP applying the missing methodology to the only free public source that has the underlying data (RECAP), and anchoring the absolute counts to DOJ's own figures. The pre-2022 baseline and the post-March-2024 trajectory are not available from any other public source we have found.
Methodology
Where every number on this page comes from
The methodology has three distinct sources doing three distinct jobs:
- All § 523(a)(8) AP counts (the actual lawsuits). RECAP / CourtListener, for the full 2008 through April 27, 2026 window. Both pre-DOJ-guidance and post-DOJ-guidance counts come from the same source applied with the same matcher. FJC's bankruptcy IDB does not contain adversary proceedings at all; RECAP is the only free national source.
- Absolute count anchors (632 / 1,220). U.S. Department of Justice press releases, August 2023 and April 2024. These are the only authoritative absolute counts published by anyone, and only for two specific cumulative windows.
- Macro context numbers (8.4 million bankruptcy filings, pro-se rates by chapter, etc.). Federal Judicial Center Integrated Database, bankruptcy petition files. FJC publishes petition-level data 2008-present; we use it for system-wide context, not for AP-specific counts.
Why this isn't already published in one place
The complete national dataset of bankruptcy adversary proceedings sits in PACER. PACER charges per document and isn't built for systematic queries, so reproducing a national count would cost real money and take serious tooling. RECAP is the free public mirror but it's incomplete. DOJ's published 632 and 1,220 figures come from their own internal case tracking. They're a party to these lawsuits, so they have authoritative numbers without needing PACER.
Why OBP's counts differ from DOJ's
DOJ has reported 632 APs in the first 10 months post-guidance and 1,220 cumulative through March 2024. OBP's RECAP-derived counts for the same window are roughly 15 to 25 percent of those figures. The gap exists for three documented reasons:
- RECAP does not contain every AP. The Free Law Project archive depends on user uploads, court-watcher tooling, and ongoing scraping. Bankruptcy adversary proceedings that exist in PACER but were never mirrored to RECAP are silently missing from any RECAP-derived dataset, including ours. Coverage is uneven across districts and weakens for older filings; pre-2018 absolute counts are floor estimates.
- Servicer-name and federal captions miss some APs. The matcher requires the case caption to name a known student loan servicer or include "United States" with a student loan signal term. APs against private servicers not in the matcher list, or APs with unusual captions, are excluded.
- Recent filings have indexing lag. RECAP receives federal docket data from PACER on a rolling basis. Filings from the past several months are systematically undercounted at any given snapshot. The 2025 and 2026 figures will rise as RECAP catches up; treat them as floors, not ceilings.
These gaps mean OBP's absolute numbers are floor estimates. The directional findings (the surge, the time-to-disposition shift, the servicer concentration) are robust because they survive the gap on both sides of the comparison.
Data sources
- Absolute counts (632 / 1,220): U.S. Department of Justice press releases, Aug 2023 and Apr 2024.
- Fiscal-year shape, district breakdown, time-to-disposition, servicer concentration: Open Bankruptcy Project § 523(a)(8) RECAP-derived dataset (v2 broader matcher), n = 2,045 dated APs from the CourtListener / RECAP archive (Free Law Project) coverage of U.S. bankruptcy adversary proceedings, FY 2008 to April 27, 2026.
- Macro context (8.4 million bankruptcy filings 2018-2024): Federal Judicial Center Integrated Database, bankruptcy petition files (cpbank08to17 + cpbank18on), processed locally.
- Underlying guidance: DOJ Nov 17, 2022 guidance text; National Consumer Law Center explainer.
Matcher (how OBP identifies APs from CourtListener)
The OBP v2 scrape identifies adversary proceedings via two parallel CourtListener queries on indexed dockets:
- Track 1 (servicer caption): Defendant-name regex on
caseNamematching any of Department of Education, NELNET, Mohela, Navient, Sallie Mae, Great Lakes Higher Education, ECMC, Pennsylvania Higher Education, Edfinancial, Aidvantage, AES / American Education Services, Discover Bank, KHEAA / Kentucky Higher Education, Wells Fargo Education, Citizens Bank, USA Funds, COHEAO, MEFA, Texas Guaranteed, OSLA, FedLoan, ACS Education, Heartland ECSI. - Track 2 (federal-only): Free-text query for
"523(a)(8)"OR"undue hardship"OR"student loan"withcaseNamematching "United States". Captures Debtor v. United States APs where the caption gives no servicer signal. - Both tracks:
court_idends inb(U.S. bankruptcy court), and case name contains " v. " or " v ". - Per-court paginated pull, no page cap (60-page sanity ceiling).
The CourtListener nature-of-suit field is empty for nearly all bankruptcy adversary proceedings, so a code-based filter (NOS = 67) is not feasible against this dataset.
Known gaps in the matcher
- APs against private servicers not in the matcher list (Discover Student Loans variants, regional state agencies, recent rebrands) may be excluded.
- APs whose docket data has not yet propagated to RECAP are excluded by default. RECAP coverage of recent filings is incomplete and improves over time.
- Pre-2018 absolute counts are floor estimates because RECAP coverage of older bankruptcy adversary proceedings is uneven.
These gaps are why OBP counts run lower than DOJ's. The directional shape of the time series and the within-dataset percentage shifts (FY-over-FY surge, time-to-disposition delta) are robust and corroborated by DOJ's own published numbers.
Caveats
RECAP indexing lag and coverage. RECAP archive coverage of older bankruptcy adversary proceedings is incomplete and uneven across districts and years. Pre-2018 absolute counts are floor estimates. RECAP receives federal docket data from PACER on a rolling basis driven by user uploads, court watcher tooling, and ongoing scraping by the Free Law Project.
Filings, not discharge outcomes. The dataset counts APs filed, not APs that result in actual discharge of student loan debt. Roughly half of filed APs settle or are dismissed before judgment. Outcome classification (discharged versus denied versus settled) requires reading order text and is not yet on this page.
Federal versus private servicers. The DOJ guidance applies to federal student loan APs handled by U.S. Trustees and the Department of Education. Private-servicer APs follow different procedural paths and are not directly governed by this guidance.
Pre-2022 comparison. DOJ does not publish § 523(a)(8) AP filing counts for the pre-2022 era. The "20 per year" baseline is OBP's RECAP-derived floor estimate for FY 2008 to FY 2022.
Time-to-disposition denominator. Median days to dispose is computed only on terminated APs. Pre-DOJ APs are nearly all terminated; only 15 percent of post-DOJ APs have terminated. The 27 percent speedup is among the post-DOJ APs that have already resolved, which may bias toward simpler / faster cases. The trend will firm up as more post-DOJ APs reach disposition.
Top districts by filing volume
Top 25 of 90 reporting bankruptcy court districts in the v2 dataset, with disposition statistics where available. The "median days" column is computed only on terminated APs; districts with low termination counts have less stable medians.
| Rank | District | Court ID | APs | Terminated | Median days |
|---|---|---|---|---|---|
| 1 | Central District of California (Los Angeles) | cacb | 40 | 11 | 359 |
| 2 | Southern District of Texas (Houston) | txsb | 36 | 5 | 226 |
| 3 | Middle District of Florida (Tampa/Orlando) | flmb | 31 | 7 | 426 |
| 3 | Western District of Washington (Seattle) | wawb | 31 | 6 | 214 |
| 5 | Northern District of Illinois (Chicago) | ilnb | 30 | 6 | 522 |
| 5 | District of Minnesota | mnb | 30 | 8 | 221 |
| 5 | Southern District of New York (Manhattan) | nysb | 30 | 7 | 574 |
| 8 | Northern District of California (San Francisco) | canb | 28 | 8 | 420 |
| 8 | District of Massachusetts (Boston) | mab | 28 | 7 | 621 |
| 8 | District of New Jersey | njb | 28 | 5 | 417 |
| 11 | Northern District of Georgia (Atlanta) | ganb | 26 | 6 | 745 |
| 11 | District of Kansas | ksb | 26 | 14 | 253 |
| 11 | Eastern District of New York (Brooklyn) | nyeb | 26 | 5 | 686 |
| 11 | District of Oregon | orb | 26 | 6 | 371 |
| 15 | District of Arkansas | arb | 25 | 1 | 341 |
| 15 | Eastern District of California (Sacramento) | caeb | 25 | 5 | 144 |
| 15 | Southern District of California (San Diego) | casb | 25 | 5 | 583 |
| 15 | Eastern District of Virginia | vaeb | 25 | 3 | 213 |
| 15 | Western District of Virginia | vawb | 25 | 4 | 223 |
| 20 | Western District of Missouri (Kansas City) | mowb | 24 | 4 | 191 |
| 20 | Northern District of New York | nynb | 24 | 6 | 280 |
| 20 | Northern District of Ohio (Cleveland) | ohnb | 24 | 4 | 666 |
| 20 | Middle District of Pennsylvania | pamb | 24 | 10 | 207 |
| 20 | Western District of Pennsylvania (Pittsburgh) | pawb | 24 | 3 | 503 |
| 20 | Northern District of Texas (Dallas) | txnb | 24 | 1 | 584 |
Full list of all 90 reporting districts is in the JSON dataset. The relatively flat distribution at the top of the table (counts of 24 to 40 across the top-25) reflects RECAP coverage rather than actual filing concentration; districts with weaker RECAP coverage will be undercounted.
Servicer concentration: the post-guidance surge is DOE-direct
The Justice Department guidance applies to federal-loan APs handled by U.S. Trustees and the Department of Education. The data shows exactly that concentration: of 1,698 post-DOJ APs in the v2 dataset, 1,446 (85 percent) name the U.S. Department of Education in the caption. Pre-DOJ DOE-named APs were 155 of 346 (45 percent). DOE-named APs grew roughly 9x post-guidance. Private-servicer APs grew much less or stayed flat. Discover Bank actually decreased.
| Defendant servicer or agency | Pre-DOJ APs | Post-DOJ APs | Total | Direction |
|---|---|---|---|---|
| U.S. Department of Education | 155 | 1,446 | 1,602 | +833% (the surge) |
| NELNET | 5 | 59 | 64 | +1,080% |
| Navient | 12 | 46 | 58 | +283% |
| Sallie Mae / SLM Corp | 20 | 35 | 55 | +75% |
| ECMC / Educational Credit Management | 21 | 21 | 42 | flat |
| Mohela | 0 | 37 | 37 | new (post-2022 only) |
| "v. United States" (no agency in caption) | 18 | 14 | 32 | declined |
| Citizens Bank | 14 | 15 | 29 | flat |
| Aidvantage | 1 | 27 | 28 | new (post-2022) |
| Discover Bank / Discover Student Loans | 68 | 14 | 82 | declined |
| AES / American Education Services | 6 | 5 | 11 | flat |
| Edfinancial | 0 | 10 | 10 | new (post-2022) |
| Pennsylvania Higher Education / PHEAA | 3 | 4 | 7 | flat |
An AP can name multiple servicers (multi-defendant captions); sums exceed total APs. The "Mohela", "Aidvantage", and "Edfinancial" rows show post-2022 entrants because those servicers only entered the federal portfolio in the consolidation that followed the loan-servicing transfers of 2021-2023, not because of the DOJ guidance itself.
What's still on the roadmap
Phase 2 (April 28, 2026) shipped: broader matcher + federal-only AP track + time-to-disposition disparity + district-level breakdown + servicer concentration. Still ahead:
- Outcome classification. For each AP in the dataset, the disposition: discharged, partial discharge, settled, denied, dismissed, or pending. Requires reading final-order text, which is gated behind paid CourtListener / RECAP tiers and PACER per-page costs. Currently not feasible on the free-data lane.
- Pro se vs. represented success rate disparity. Coded from party / attorney metadata. The CourtListener parties endpoint requires a paid tier; pursuing alternative free signals.
- Plan classification. Chapter 7 versus Chapter 13 versus Chapter 11 of the underlying bankruptcy. CourtListener does not consistently expose chapter on AP records (only 10 of 2,045 populated; 2 of 2,045 in caption text). Requires parent-case lookup behind paid tiers; not feasible on the free lane.
For journalists, researchers, and policy staff
If you're working on a piece, a brief, or a study that touches student loan dischargeability, we're happy to share the working dataset, walk through the methodology, or pull a focused cut for your jurisdiction. The institutional contact is info@openbankruptcyproject.org.
The Open Bankruptcy Project is a 501(c)(3) public charity (EIN 41-5159631) operating in the public interest. We do not represent clients, take referral fees, or sell data. Methodology, source code, and data are public on GitHub.
Citation
Open Bankruptcy Project, § 523(a)(8) Adversary Filings: National Tracker (v2 broader matcher), https://studentloandefault.org/research/523a8-discharge-trends/ (last updated April 28, 2026). Absolute post-guidance counts: U.S. Department of Justice press releases, August 2023 and April 2024.